Ethereum price has held onto its bullishness on the one-day chart. In that timeframe, the altcoin has managed to increase in value by 3%.
Over the last week, the coin rallied over 21%, breaking past multiple resistance levels, which has further strengthened the bulls.
The coin has to zoom past two important resistance lines in order to continue its bullish streak. The technical outlook of the coin continued to display bullish momentum.
There was a surplus of buyers as Ethereum price shot up to the overbought zone. Bitcoin has finally settled at the $20,000 price mark over the last 24 hours, turning other altcoins positive too.
Ethereum price has been rangebound for multiple weeks, but with the overall market turning green, the coin has helped the altcoin eye its next major resistance line.
If ETH manages to break past the $16,000 zone, then a move to the $2,000 price mark could be likely. On the other hand, if buying strength loses steam, then ETH can again start to exhibit rangebound price movement.
Ethereum Price Analysis: One Day Chart
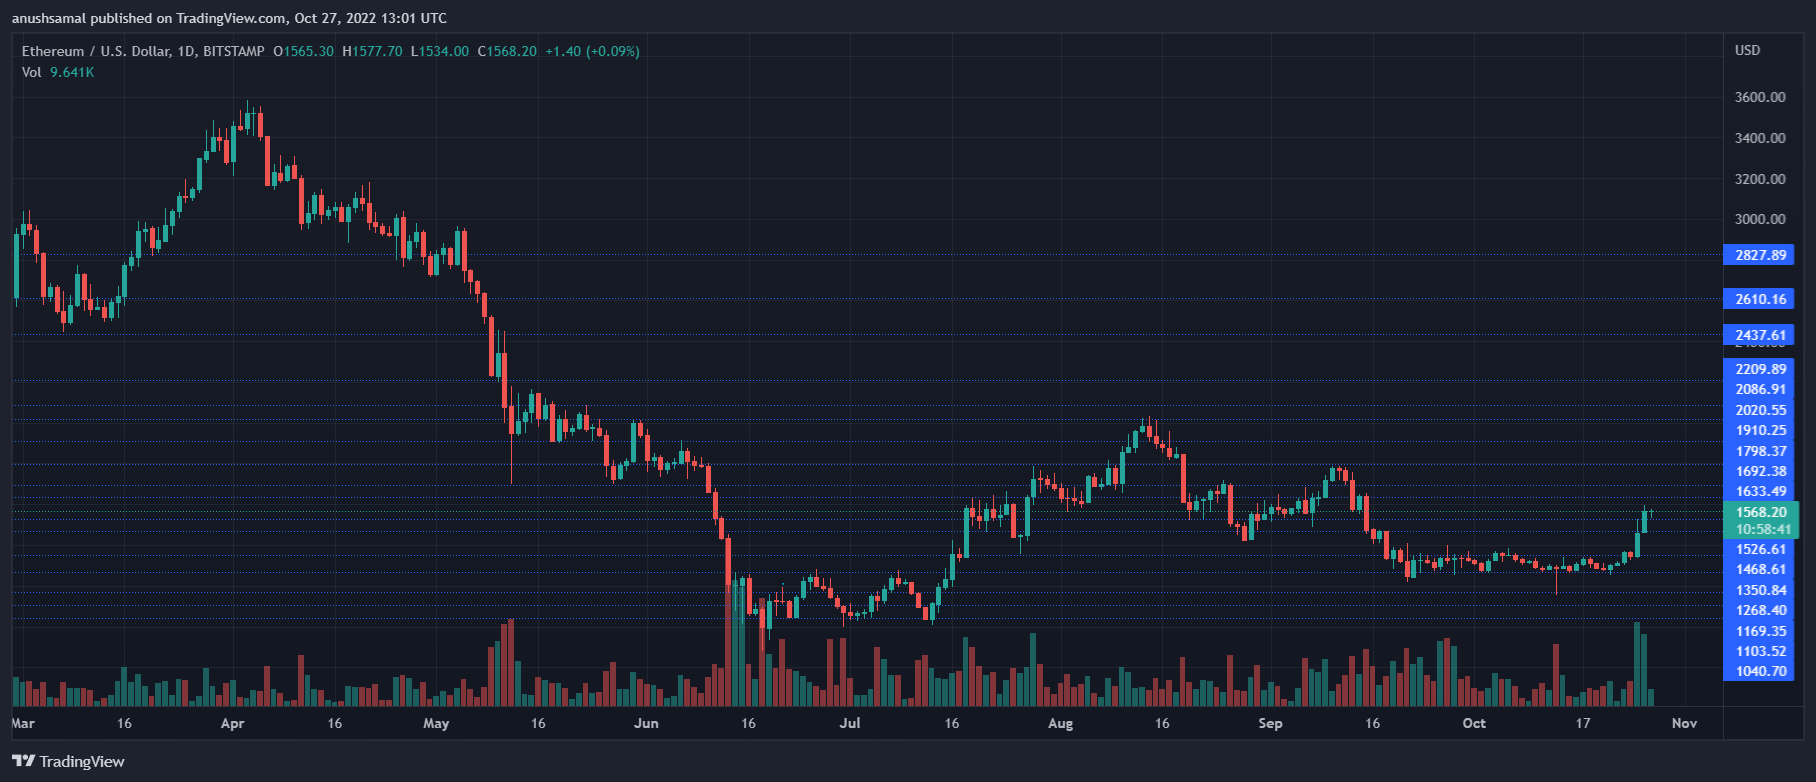
ETH was trading at $1,560 at the time of writing. Ethereum price has soared considerably over the past week, breaking past its consolidation phase.
If the coin has to sustain this price momentum, it is important that it trades above its immediate resistance of $1,630. Moving past that level will help the bulls challenge the $1,700 price mark.
This would help the bullish thesis gain strength. Once the altcoin moves past the $1,900 mark, Ethereum price will be completely in the control of the bulls.
In case the surge doesn’t last, a fall will bring the altcoin to $1,300 first and then finally to $1,200. In the past few trading sessions, the amount of ETH traded witnessed an increase, pointing towards higher demand for the altcoin.
Technical Analysis
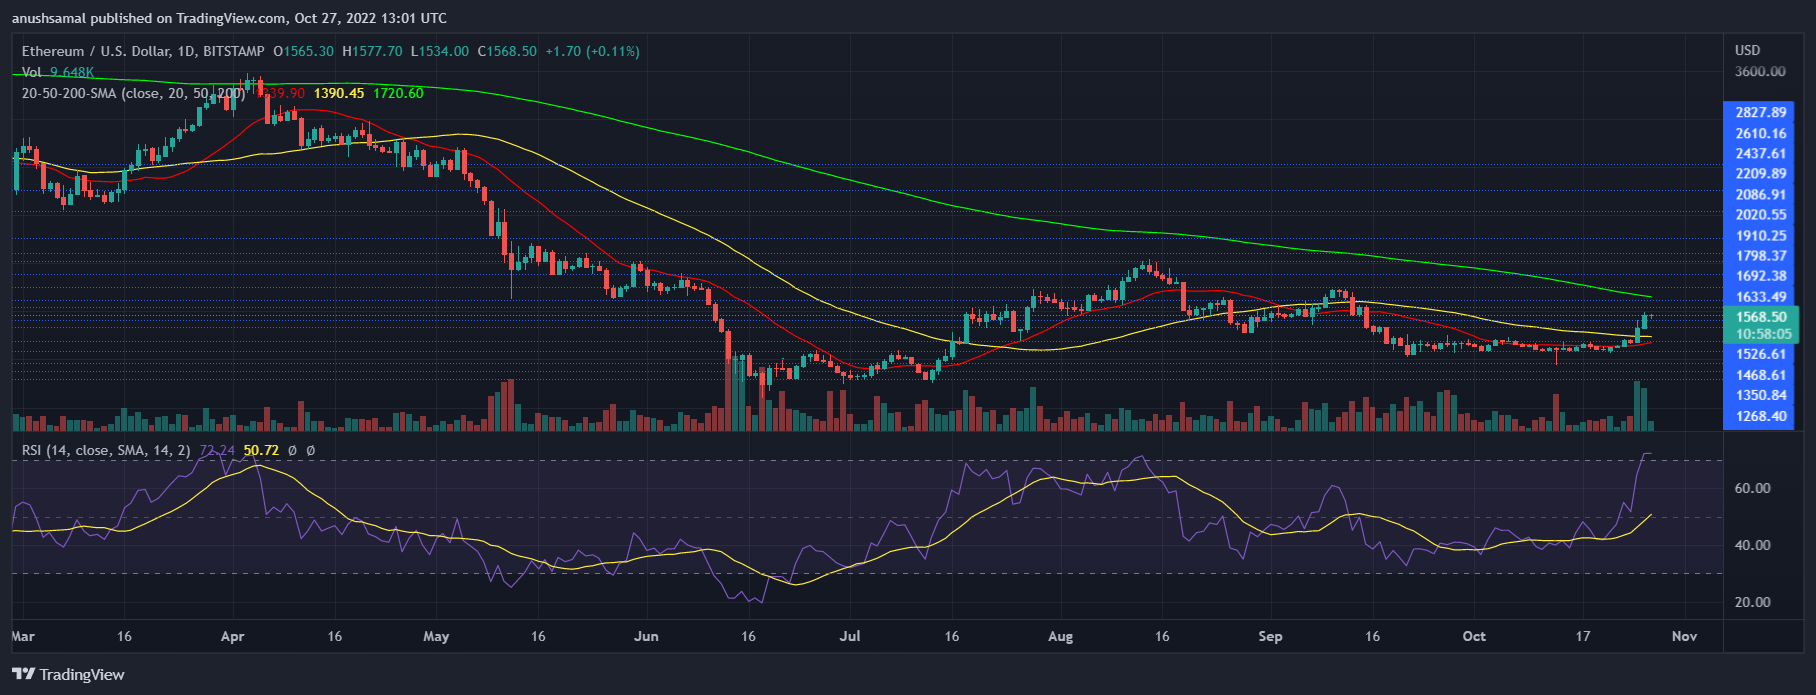
The altcoin was overbought on the one-day chart. The last time Ethereum visited this zone was in the month of August.
This marked a multi-month high for the altcoin in relation to the buying pressure it witnessed. The Relative Strength Index was above the 80-mark, which signifies that ETH was overbought as demand for the coin increased.
Ethereum price was above the 20-SMA line, which was a sign of bullishness as buyers were driving the price momentum in the market.
With sustained demand, the 20-SMA could cross above the 50-SMA line, forming a golden cross, which is considered to be bullish.
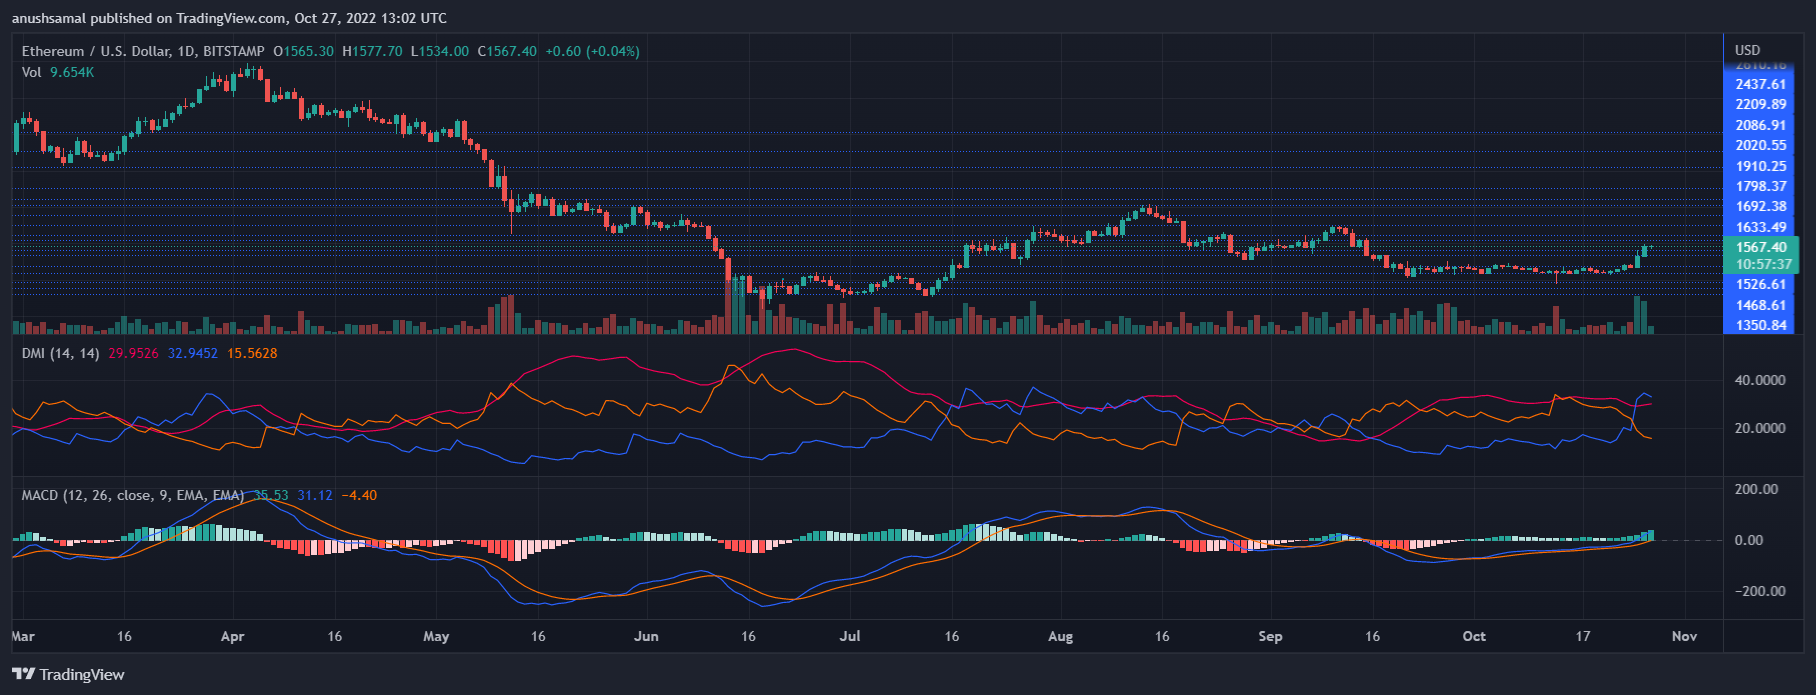
The other technical indicators were also quite bullish, supporting the notion that buyers had taken over. Moving Average Convergence Divergence indicates the price momentum of the coin and the price direction.
The MACD was positive as it formed green signal bars which were growing. This pointed to a buy signal for the coin.
The Directional Movement Index was also positive as +DI was above the -DI line, which signals a bullish price direction.
The Average Directional Index (red) was above the 20-mark, forming an uptick pointing in the price direction, gaining strength.
Featured Image From UnSplash, Charts From TradingView