Bitcoin price is consolidating above the $42,500 support zone. BTC could gain bullish momentum if it clears the $43,500 resistance zone.
- Bitcoin price is still struggling to clear the $43,400 and $43,500 resistance levels.
- The price is trading above $42,500 and the 100 hourly Simple moving average.
- There is a key rising channel forming with support at $42,450 on the hourly chart of the BTC/USD pair (data feed from Kraken).
- The pair could start a strong increase if it clears the $43,500 resistance zone.
Bitcoin Price Aims Higher
Bitcoin price formed a base above the $41,800 level and started a steady increase. BTC was able to clear the $42,200 and $42,500 resistance levels.
It also reclaimed the 100 hourly Simple moving average. The price climbed above the 50% Fib retracement level of the downward move from the $43,488 swing high to the $42,320 low. The bulls even pushed the price above the $43,000 level.
However, the bears seem to be active near the $43,200 level. It is near the 76.4% Fib retracement level of the downward move from the $43,488 swing high to the $42,320 low.
Bitcoin is now trading above $42,650 and the 100 hourly Simple moving average. Immediate resistance is near the $43,200 level. The next key resistance could be $43,500, above which the price could start a decent increase. The next stop for the bulls may perhaps be $44,200.
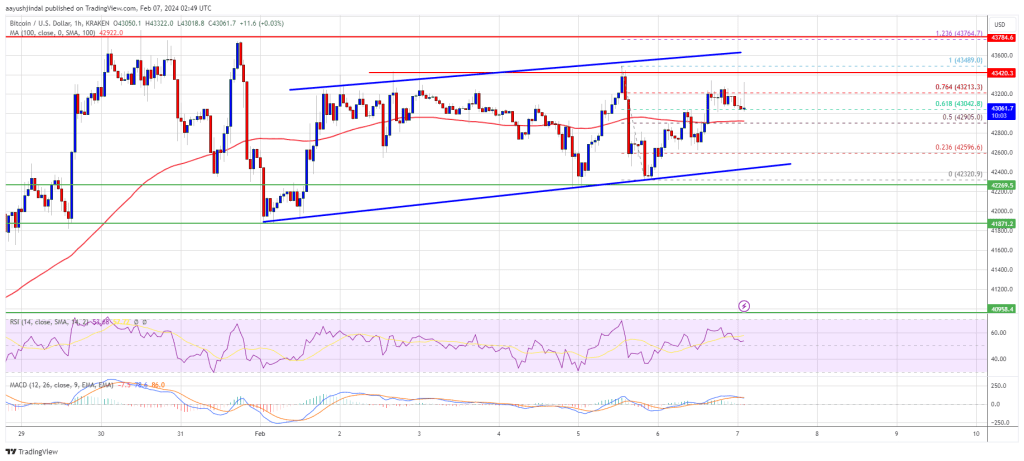
Source: BTCUSD on TradingView.com
A clear move above the $44,200 resistance could send the price toward the $45,000 resistance. The next resistance is now forming near the $45,500 level. A close above the $45,500 level could push the price further higher. The next major resistance sits at $46,500.
Another Decline In BTC?
If Bitcoin fails to rise above the $43,500 resistance zone, it could start another decline. Immediate support on the downside is near the $42,900 level and the 100 hourly SMA.
The first major support is $42,450 and the channel trend line. If there is a close below $42,450, the price could gain bearish momentum. In the stated case, the price could dive toward the $41,800 support.
Technical indicators:
Hourly MACD – The MACD is now losing pace in the bullish zone.
Hourly RSI (Relative Strength Index) – The RSI for BTC/USD is now above the 50 level.
Major Support Levels – $42,900, followed by $42,450.
Major Resistance Levels – $43,200, $43,400, and $43,500.